March 13, 2013
- in Uncategorized by schooloftrade
E-Mini S&P Chart Prep

 |
| E-Mini ES Day Trading |
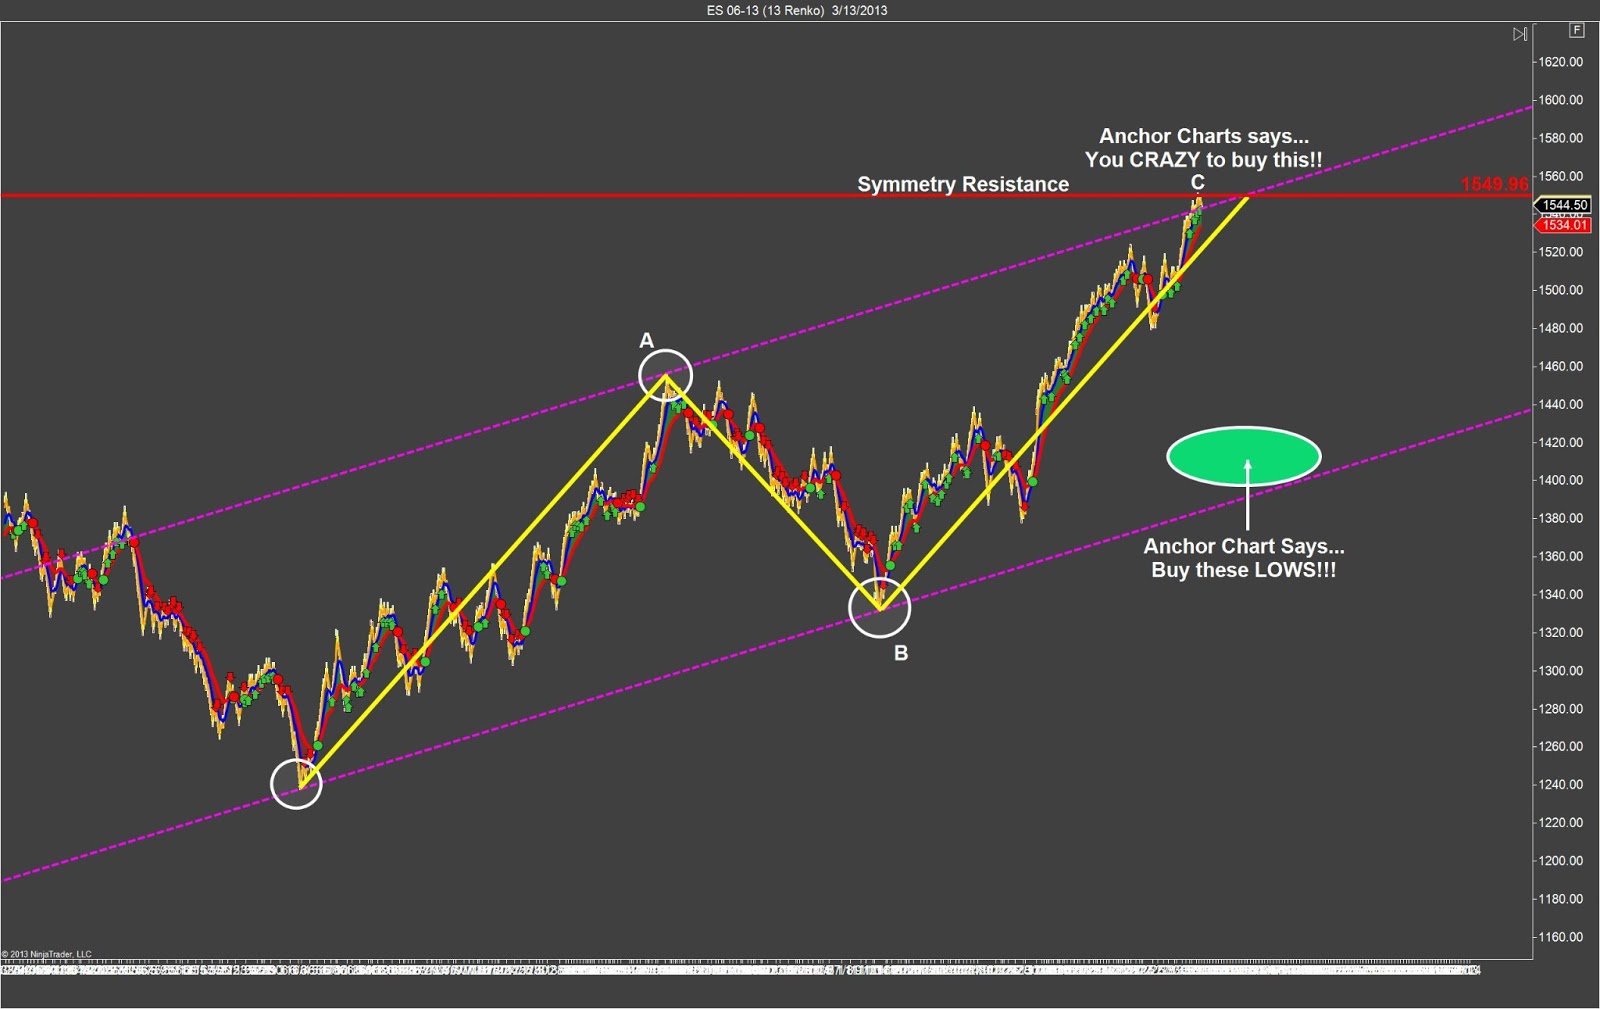
The Anchor
chart on the E-Mini S&P shows us a strong bullish price-channel along with
major resistance from the symmetry set-up.
We cannot buy right now at the highs of the price-channel because the resistance
is too strong, and even if the buyers are in control we will have a very
challenging time getting into long positions at these highs. We are looking to SELL the highs, and we need
to see a new lower-low along with the entry signal SHORT on our entry charts.