- in Uncategorized by schooloftrade
Day Trading Morning Prep Gold, Crude Oil, Dollar Index, Euro, E-mini Russell Futures
 The dollar index shows us right in the middle of the price Wedge Pattern.
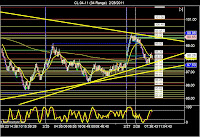
 Crude oil is trading at the lows of a price wedge, so this chart gives us some easy trading opportunities this morning.
- Price channel in pink trend lines
- Wedge pattern in yellow trend lines
- Previous High of Day
I want to keep the price channel in my mind first, so look to buy at support as price pulls back from this very clear bullish trend.
I also need to watch out for the price Wedge Pattern in the yellow trend lines overhead resistance around 1417.0. I dont want to buy into these highs.
When trading at new highs, If price breaks new highs I will Buy a Pullback at support rather than trading into the highs.
and dont forget about the PHOD also around 1417.0. Remember that if price stays below the PHOD the sellers are in control. If price breaks above the PHOD the buyers are now in control again.
- price wedge pattern in yellow trend lines
- Sideways market in the white box
- Previous HOD
we want to sell the highs and buy the lows of the wedge, making sure to avoid the area in the middle. Buy support if prices drops, so buying at 3710, 3642, 3600 is the low of the wedge.
the sideways market is also something to use for trading opportunities. Buy the lows, sell the highs, and avoid the middle of a sideways range, the same as other patterns.
Sell the highs of 3834, buy the lows of 3710, but if price breaks this sideways range…
to avoid a Fake-out breakout trading the highs or the lows of the range, lets buy pullbacks and sell retracements.
dont forget the PHOD of 3834, if we break above the PHOD the buyers are clearly in control, and if we break below the PHOD, or in this case stay below, the sellers are in the contol.
I want to sell the PHOD as resistance, and buy the PHOD as support.
E-mini Russell Futures

