- in Uncategorized by schooloftrade
day trading strategy for jobless claims news

our day trading strategy begins with the dollar index, and we use this to find the short term trend and the major turning points in the market. the dollar has a negative correlation so support on the dollar is considered resistance on the markets we trade. We want to see the trending or about to reverse that trend to give us an ‘edge’ we need to swing the odds in our favor.
It looks like the short term trend, which was moving higher, is about to stall and go sideways. You can see lower lows, lower highs, and its in the middle of the channel. We need to watch the SHORT TERM trend, not the long term trend, and this is concerning.
We also need to locate major turning points, which are also a little concerning, as you can see the channel highs way up above us, and the channel lows far below us.
If the dollar index moves higher above 79.315 we will consider this to be a short term trend up, but if the market trades sideways we need to consider there to be no trend at all, and if the market fails to go higher and reverses we will look for a new short term trend moving lower.
If the Dollar Index makes a new higher high it will likely go to 79.400 channel highs, so I want to continue to sell retracements with new lower lows on crude oil, euro, gold, etc. If the dollar trades sideways I want to beware sloppy price action and sit on my hands. If the dollar break below 79.200 area we expect to see 78.970 tested next which means im then looking for a price reversal trading opportunity buying the lows on crude oil, euro, russell, etc.
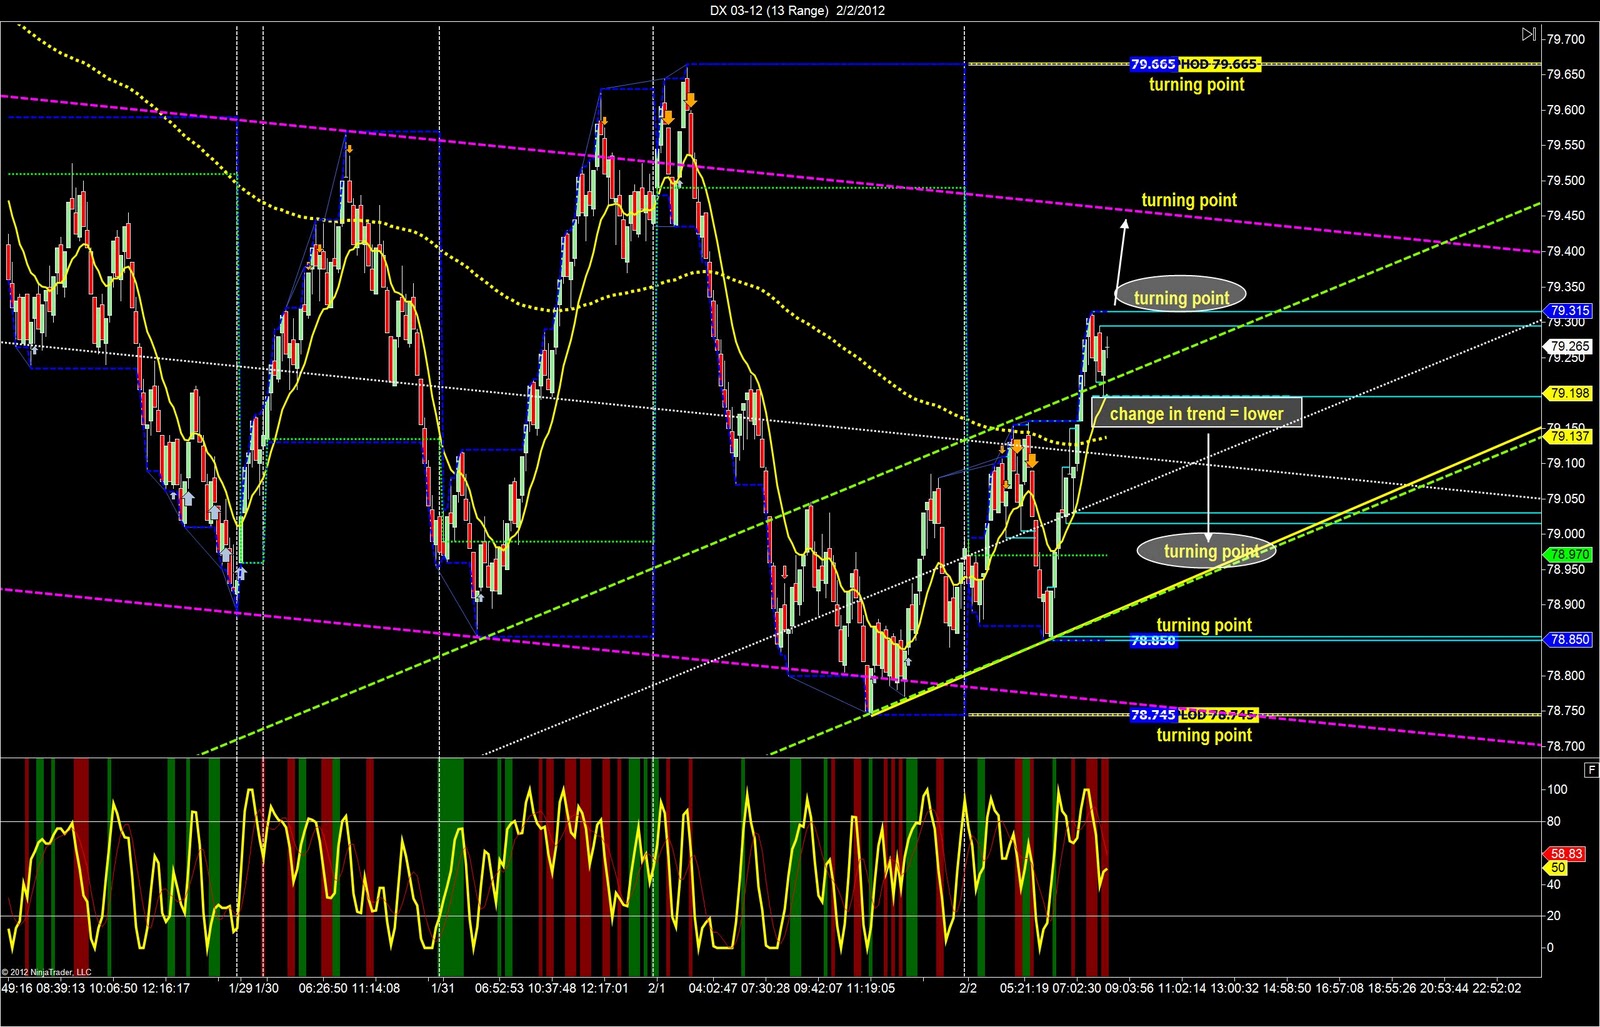 |
| Dollar Index Day Trading Strategy |
Crude Oil futures day trading strategy uses the 89range chart to find the most important levels of support and resistance along with the best areas to look for trades. We can see the bear price channel, the lows below the trigger zone, and then double-top support just below us at 95.90.
We’re going to use this chart to find the AREAS we are looking to take trades, and then the 34-range chart will show me the specific trading entry locations.
 |
| Crude Oil Day Trading Strategy |
Crude Oil 34range chart shows us we are trading just below the PLOD so we are looking to buy when we get back above the PLOD and try to keep buying all the way up to the next level of major resistance. We want to buy when the sellers fail below the PLOD, and if the price can get above the 98.00 we are inside the wedge which was broken from yesturday which will be another great buying opporutnity. We will take profit at the misc resistance levels overhead, and then looking to re-enter the trade long by buying a pullback when the resistance is broken, turning into support.

Our 21-range chart on crude oil futures shows us a well-refined trading strategy using the PLOD and the bearish price channel.

our day trading strategy for the euro begins with this price wedge and inside day. We want to sell the highs and buy the lows of the wedge, along with avoiding the middle. our 89-range will give us the general area to look for trades, while the 34-range will give me the specific entry locations.
 |
| Euro day trading strategy |
The Euro 55 range chart shows us the trading strategy for a price wedge. Buy the lows, sell the highs, and avoid the middle. If price moves below the PLOD we then look to sell retracements. If price moves above PHOD we buy a pullback, which will also have us buying the lows of the bull price channel.
