- in Uncategorized by schooloftrade
Day Trading Gold with Multiple Chart Timeframes

This morning we used multiple chart timeframes to anticipate a price reversal on Gold Futures, and enter into long trading opportunities once the reversal was completed.
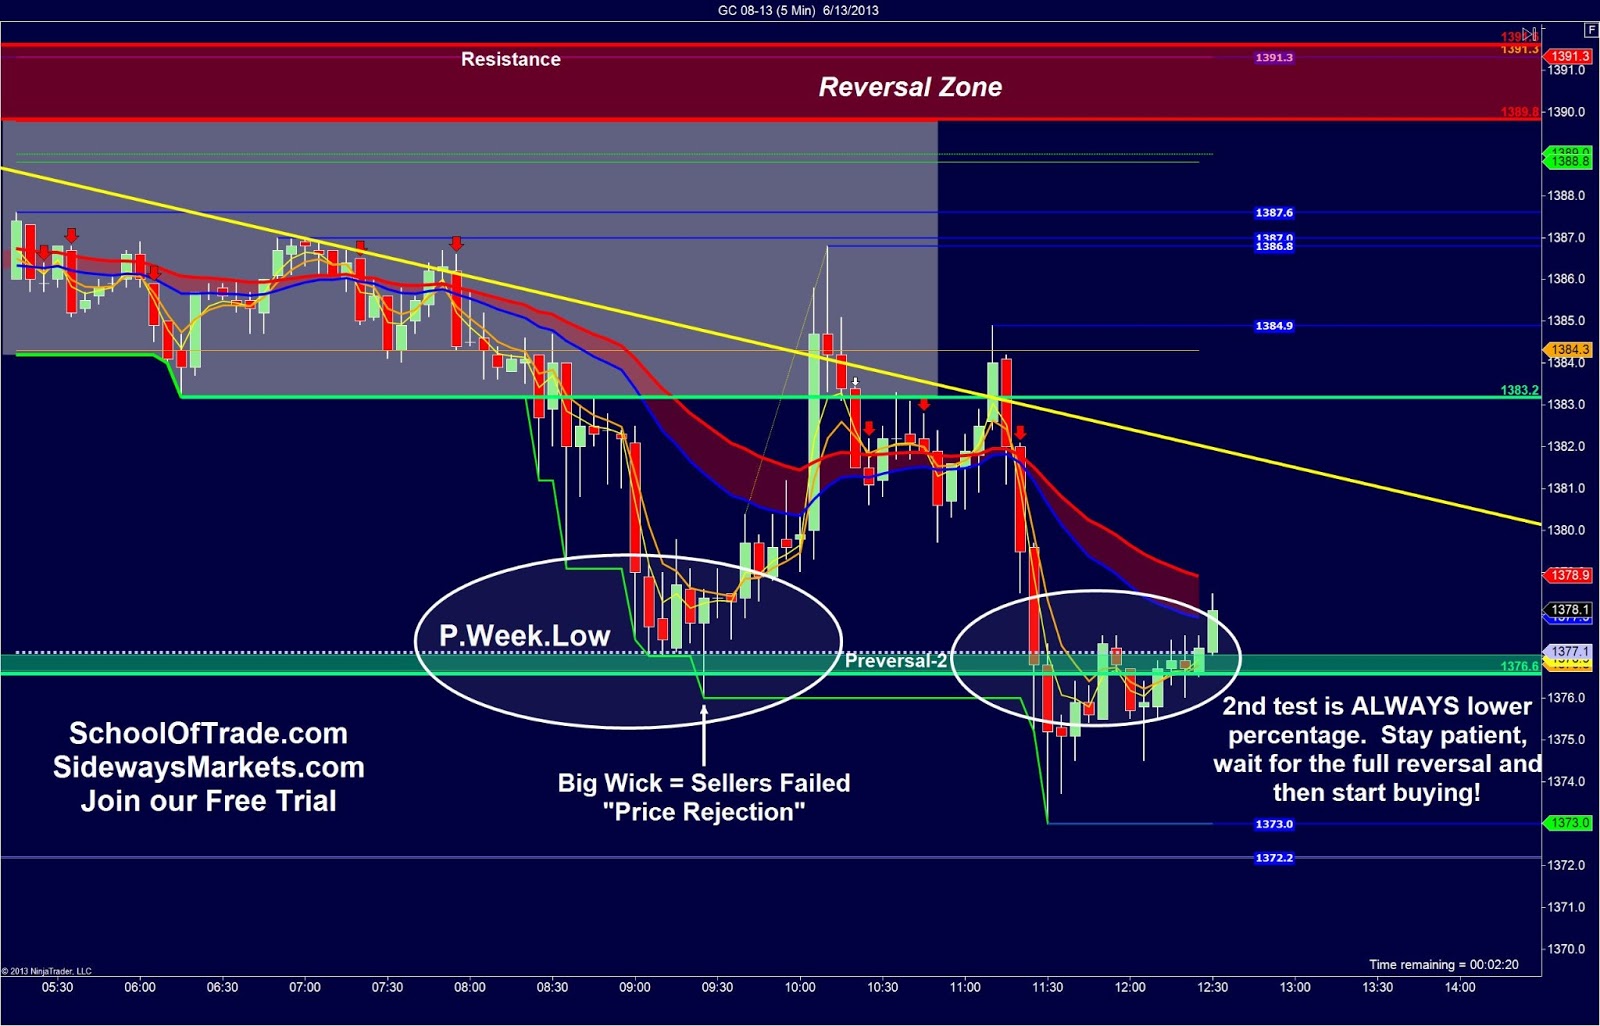 |
| Gold Anchor Chart |
We began with a 5-minute anchor chart on Gold and noticed the Previous Week’s Lows were being tested as major support. The candlestick that tested this support could NOT close below it, and we used that as our biggest clue to look for BUYING opportunities.
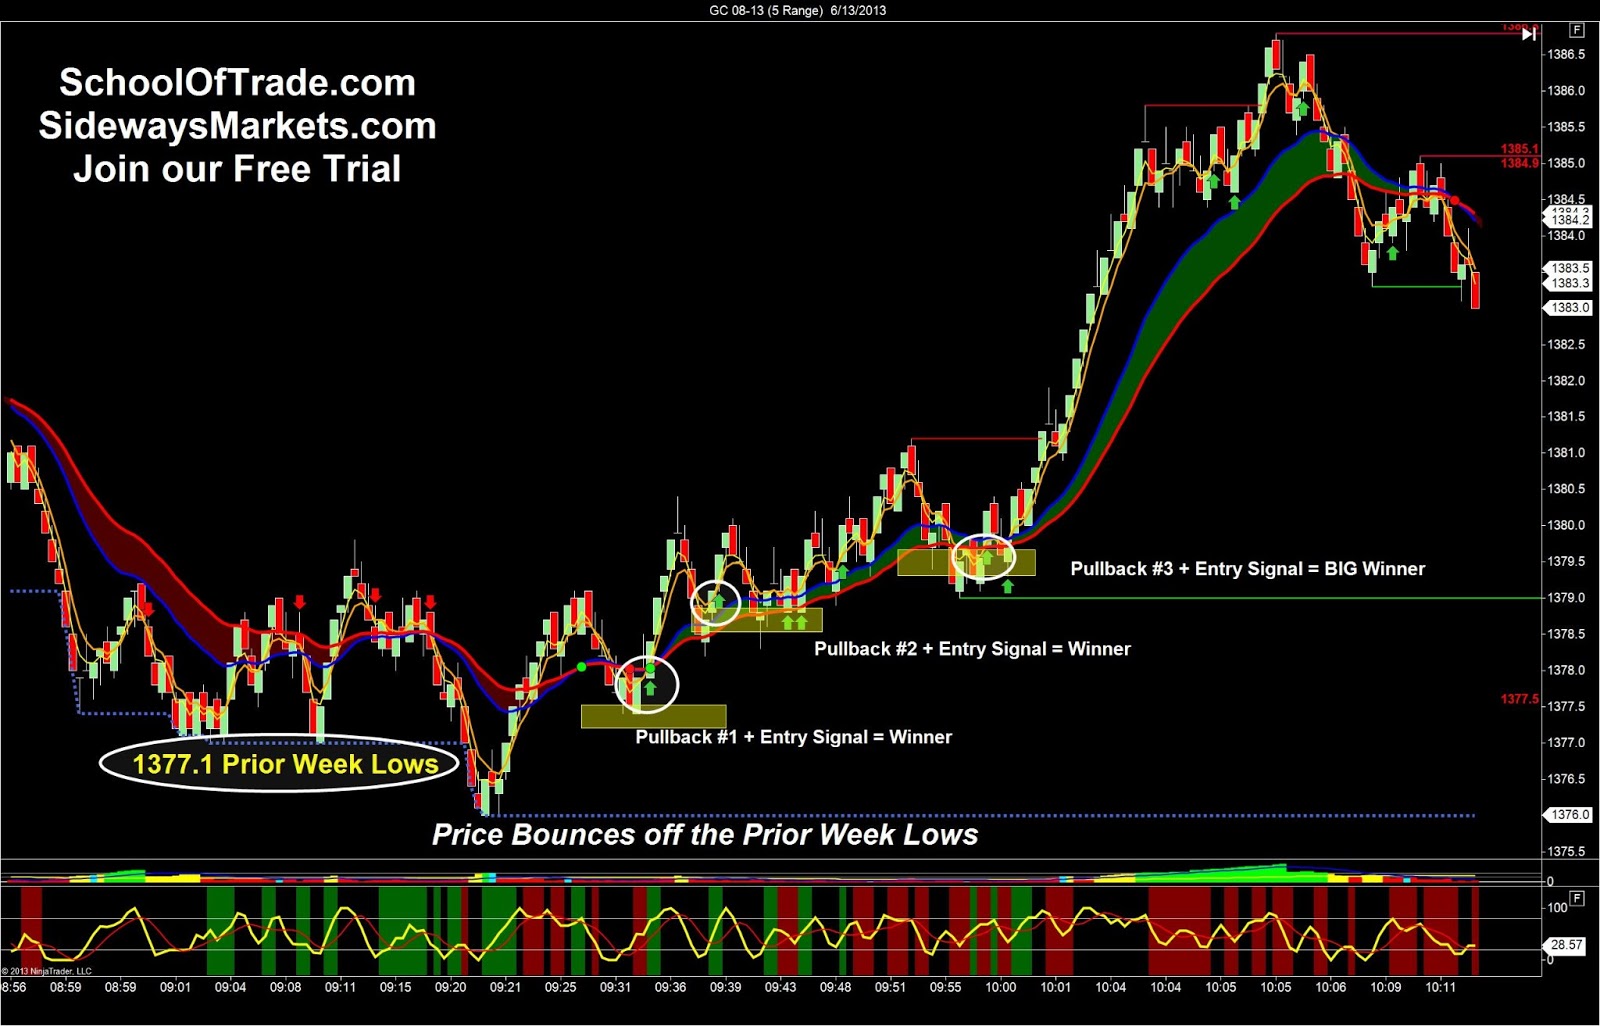 |
| Gold Entry Chart |
Once we know the ‘sellers had failed’ we then moved to our entry chart timeframes and looked for simple pullbacks to get long. We use Fibonacci and a simple technical indicator that provides our members with EASY signals to enter with me LONG.
Did you see these trades today?
Join our Live Trade Room as a student and let’s make some profit together!