January 14, 2014
- in Uncategorized by schooloftrade
Day Trading Newsletter 01/14/14; SchoolOfTrade.com

“Life isn’t about all
the wrong moves you made; life is about the one right move that made ALL the
difference.”
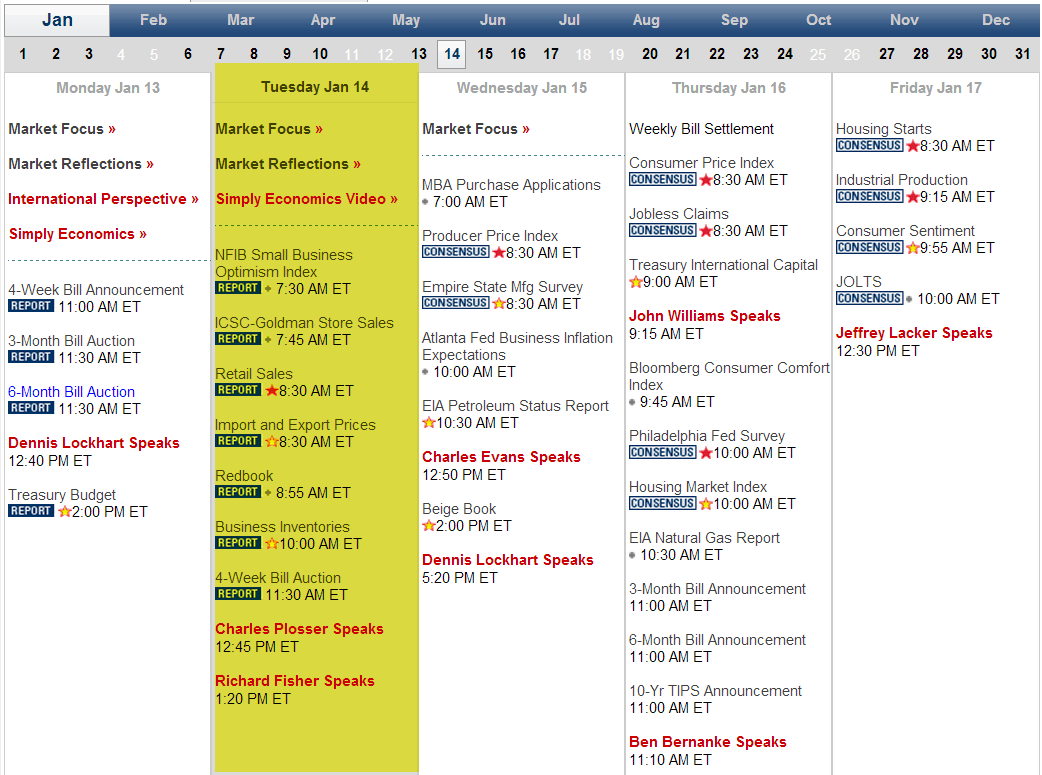
Economic News for Tomorrow:
Tomorrow
morning we have another day with some big news on the calendar to get the price-action
moving well for our trades.
morning we have another day with some big news on the calendar to get the price-action
moving well for our trades.
We begin with MAJOR Red-Star news from
Producer Price Index. This will hopefully give us some good volume
and volatility to get us making money early in the session.
Producer Price Index. This will hopefully give us some good volume
and volatility to get us making money early in the session.
Later in the session we have
important news for Crude Oil traders. Tuesday evening we
saw the 3rd consecutive draw in inventories from the API Report that
was released at 4:30pm EST on Tuesday evening.
important news for Crude Oil traders. Tuesday evening we
saw the 3rd consecutive draw in inventories from the API Report that
was released at 4:30pm EST on Tuesday evening.
8:30am EST Producer
Price Index |
Price Index |
Empire
State Manuf Survey
State Manuf Survey
10:30am EST Crude
Oil Inventories
Oil Inventories
2:00pm EST Beige
Book Report
Book Report
Day trading plan for Tomorrow:
Crude Oil:
VIP Chart:
Crude Oil has been quite sloppy this week so far, and our VIP
chart confirms that for us this evening.
chart confirms that for us this evening.
 |
| Crude Oil VIP |
We can see the multi-day relationship is almost sideways as
we trade inside the range from earlier in the month of January.
we trade inside the range from earlier in the month of January.
Today’s trading-range was quite narrow, which suggests we are
going to see some fireworks SOON, but we don’t know exactly when. A narrow trading-range today suggests a wide trading-range
tomorrow, so perhaps we will see those fireworks after tomorrow’s news about
inventories?
going to see some fireworks SOON, but we don’t know exactly when. A narrow trading-range today suggests a wide trading-range
tomorrow, so perhaps we will see those fireworks after tomorrow’s news about
inventories?
Closing-print was in the middle of the range today, which
tells us the buyers and sellers were both in balance. Closing in the middle tells us that we have
buyers and sellers agreeing on this price.
tells us the buyers and sellers were both in balance. Closing in the middle tells us that we have
buyers and sellers agreeing on this price.
The next step is going to be to analyze tomorrow’s opening-print
to see where it comes out in relationship to today’s closing-print.
to see where it comes out in relationship to today’s closing-print.
Anchor Chart:
 |
| Crude Oil Anchor |
Crude Oil looks mighty bullish on our anchor chart, which is
a big change of pace from the VIP chart.
a big change of pace from the VIP chart.
We are above all the moving-averages and we have higher-highs
and higher-lows which tell us we want to buy this market right now using a wave-pattern
long.
and higher-lows which tell us we want to buy this market right now using a wave-pattern
long.
I can see levels of resistance to use as profit-targets above
us at 92.89, 93.00, 93.23, 93.33, and 93.48.
us at 92.89, 93.00, 93.23, 93.33, and 93.48.
Our goal tonight and tomorrow is to buy using our wave-pattern
long and use these levels above us as profit-targets.
long and use these levels above us as profit-targets.
Gold:
VIP Chart:
The Gold VIP Chart is filled with big clues this evening,
starting with this multi-day relationship, today’s range and closing-print.
starting with this multi-day relationship, today’s range and closing-print.
We’ve been pushing new higher-highs for over a week but today
we saw those buyers get stuck at new highs, only to tumble HARD all the way
down to the lows of the range from Monday.
we saw those buyers get stuck at new highs, only to tumble HARD all the way
down to the lows of the range from Monday.
 |
| Gold VIP |
The size of today’s trading-range is very large, which
suggests that tomorrow will be a narrower trading-range type of day.
suggests that tomorrow will be a narrower trading-range type of day.
The closing-print today was inside Monday’s range, which
suggests that all this chaos on the chart today was nothing more than
speculators having some fun.
suggests that all this chaos on the chart today was nothing more than
speculators having some fun.
With the closing-print inside the range from Monday, and a
very wide trading-range today, we can assume tomorrow will be a narrow, range-bound
market that opens inside today’s range.
very wide trading-range today, we can assume tomorrow will be a narrow, range-bound
market that opens inside today’s range.
Anchor Chart:
 |
| Gold Anchor |
Gold is moving lower with a slight sideways trend as we go
into Wednesday’s trading session. Gold lost
some ground this morning after today’s Retail Sales Report came out higher than
expected, suggesting that December’s Holiday Spending was very robust.
into Wednesday’s trading session. Gold lost
some ground this morning after today’s Retail Sales Report came out higher than
expected, suggesting that December’s Holiday Spending was very robust.
We can see a bearish price channel has developed on the
anchor chart, and with all the moving-averages above us as resistance we are
looking for selling opportunities this evening and tomorrow morning until this
changes.
anchor chart, and with all the moving-averages above us as resistance we are
looking for selling opportunities this evening and tomorrow morning until this
changes.
If price rises before it falls lower I am looking for selling
opportunities at the 1248.0 sell-zone overhead, along with the 1251.9 sell-zone
above that. If we happen to break these
and move higher we then know the sellers have failed and we will begin looking
for buying opportunities to take us back to the high of day today at 1254.9 as
a profit-target for the buyers.
As price moves lower we are looking for the wave-pattern
short to get into the trade, and then we will use the levels of support listed
below as profit-targets starting with 1239.0, 1237.3, 1235.4 and the big target
of 1232.1
short to get into the trade, and then we will use the levels of support listed
below as profit-targets starting with 1239.0, 1237.3, 1235.4 and the big target
of 1232.1
Mini-Russell:
VIP Chart:
The Mini-Russell had a big day today moving back up to the highs
of the weekly trading-range.
of the weekly trading-range.
| Russell VIP |
We can see the VIP chart shows us that we have been trading ‘inside’
for over a week now, and today we went literally from the bottom ALL the way
back up to the top.
for over a week now, and today we went literally from the bottom ALL the way
back up to the top.
We can see a typical trading-range for today, but the BIG
CLUE is the closing-print at the highs, which suggests that the buyers had
complete control when we finished the session today.
CLUE is the closing-print at the highs, which suggests that the buyers had
complete control when we finished the session today.
The next step is to look at the opening-bell tomorrow morning
and compare that to the closing-print from today. That will tell us if we are still bullish, or
if this is just a sideways-trading-range that we can see at these highs.
and compare that to the closing-print from today. That will tell us if we are still bullish, or
if this is just a sideways-trading-range that we can see at these highs.
Anchor Chart:
 |
| Russell Anchor |
The Mini-Russell moved higher this morning on a very bullish
Retail Sales Report at 830am EST, and it never looked back.
Retail Sales Report at 830am EST, and it never looked back.
We can see a bullish price channel, green cloud, and we are
above all the moving-averages. All of
these clues tell us to look for a wave-pattern long to buy with this
above all the moving-averages. All of
these clues tell us to look for a wave-pattern long to buy with this
long-term-trend.
We can see profit-targets overhead at 1161.4, 1162.7, 1164.5,
and 1167.2
and 1167.2
===========================================================
Want to see us trade LIVE?
Click here to register for the
Free Trial!
Click here to register for the
Free Trial!
Automated Trading Strategy; Let the
Computer do the trading
Computer do the trading
Are you a Crude Oil Trader? Click here to
trade Crude Oil
trade Crude Oil
Are you a Euro Trader? Click here to
trade Euro
trade Euro
Are you an E-Mini Russell Trader? Click here to trade
E-Mini Russell
E-Mini Russell
Are you a Gold Trader? Click here to trade
Gold
Gold
Join the Premier Live trade-room as an Advanced Member